Mapping a whole darn year

2009 travel in Cambridge and Boston

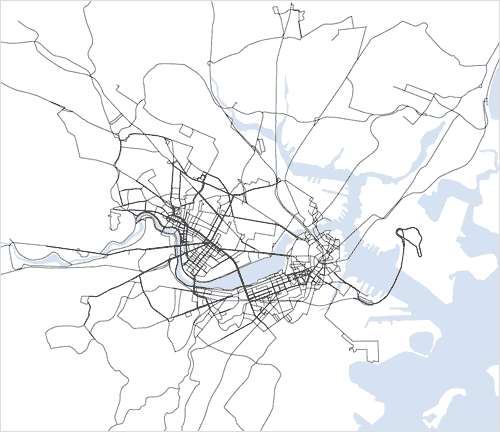
In the past I have mentioned here an ongoing project to trace my every movement on a map, using memory and mouse-clicking rather than technology that costs money. Well, the advent of 2010 marks a full calendar year of doing this and a good moment to show some results.

Obviously this is not a novel concept (to choose a single example, I must link to UrbanTick here), and nobody besides me cares about the particulars of my travels. Shut up, it’s fun anyway. There are two reasons why this originally sounded interesting. First, I work from home, and there is very little routine in my trips out of the house, both in timing and destination. Rather than a predictable daily grind, I could hope for a an unknown awesome-looking pattern. Second, I keep the tracks separated by mode of transportation (foot, car, train, bus, and bike so far). A portrait of urban mobility or some such. As I bonus I will add that for a urban geography and cartography nerd, this project works as motivation to get out and explore different parts of town. There are witnesses to my excitement over being able to add a new line to the map.

Goals for 2010:

  • Cover more ground! I still haven’t made it to half of Cambridge, and there is a lot of neighboring Boston and Somerville to explore.
  • Use a bicycle more than four times in a year. It is perhaps the best way to get around town and shouldn’t be collecting dust.
  • Collect more data, such as distance, for summary statistics. This may require more sophisticated techniques than simply drawing lines, though, which would conflict with my New Year’s resolution to be more technologically lazy.

* Sorry for making this an increasingly Boston-centric blog, but hey, for your own projects you start with what’s outside your front door too, right? Not that I actually have a front door.

Tagged , , ,

17 Comments

  1. Pretty cool. It has a lightning strike look to it as it plays. I wonder, could you progressively increase line width or color intensity as certain routes are repeated? The transparency effect only goes so far and I noticed several routes were repeated many times.

    What software did you use to create the flash map?

    David Medeiros
    5 January 2010 @ 2:11pm

  2. I really like it, this is a great project. I have to confess, that I did not really believe you would ever last a year doing this by hand, CONGRATULATIONS.
    The visualisation is beautifully simple, brilliant.
    And now, get yourself a GPS!

    urbantick
    5 January 2010 @ 3:15pm

  3. Heh, thanks. Yeah, maybe it’s time for a GPS. That just takes all the charm out of it, though!

    David: I just used Flash CS4, having imported everything from Illustrator. Basically each day was imported to a keyframe in an animation. Changing line widths at this point would be difficult, but messing with color intensity is a good idea. The minimum opacity I used there is something like 20 percent (so that the lightly-traveled paths would show up at all), but those most frequent certainly do become fully opaque quickly.

    Andy Woodruff
    5 January 2010 @ 5:00pm

  4. this just shows (again) why this is my favorite blog. ever. thanks

    Mark Harrower
    5 January 2010 @ 9:01pm

  5. Hi Andy,

    Cool stuff. I run a Meetup group in the SF Bay Area called WebMapSocial. Mind if I spam the group with your fun map? http://www.meetup.com/webmapsocial

    Thanks,
    Catherine

    Catherine Burton
    8 January 2010 @ 2:35pm

  6. Thanks, Catherine. Spam away!

    And then let’s start an east coast/west coast personal mapping war.

    Andy Woodruff
    8 January 2010 @ 2:59pm

  7. Very cool animation! In regards to the charm of manually mapping out your trips, I used to feel the same way about geotagging photos. It was fun to go back and follow the map as I placed the photos myself.

    Then I had a kid, and no longer have time for manually mapping anything 🙂 Interested to see if you come up with a good GPS solution.

    Jason Morrison
    13 January 2010 @ 1:37am

  8. This is awesome, and displays a rather admirable use of various modes of transportation.

    What did you use to actually log each trip? Just a simple database/spreadsheet, or was there any sort of simple software or web-based tool you used to keep track of each location and mode of transport?

    Again, great job; couldn’t agree more about the charm aspect of the manual way. Although if you did decide to use something like Google Latitude or Foursquare, I’d be intrigued to see what else you could develop.

    Kyle Bunch
    19 January 2010 @ 12:53pm

  9. Nice! I did exactly the same thing back in the late 90s and early 00s. Also without a GPS. See my blog:

    http://www.oskarlin.com/2005/10/24/never-ending-drawing-1/

    Oskar Karlin
    19 January 2010 @ 5:09pm

  10. Oskar: Amazing! I did indeed use the exact same method as you. I’m happy to know that there’s somebody else out there with the same foolish persistence. Love that composite map, by the way.

    Kyle: Nothing even as sophisticated as a spreadsheet; I just traced over a map pasted in Illustrator, with a separate layer for each day (further separated by mode of transportation). It’s somehow at once lazy and painstaking.

    Andy Woodruff
    19 January 2010 @ 5:47pm

  11. Brilliant — lazy but painstaking is my favorite kind! But it would be great if someone would write an app using the Foursquare API to automate this process and make it distributable.

    I’ll add it to my list. For a lazy but painstaking implementation, naturally.

    Kyle Bunch
    26 January 2010 @ 10:16am

  12. So freakin’ cool!!! Great maps, too. Saw the ‘can’t get there from here’ one in the Globe. Am obsessed with maps — new and old — of Boston. Keep ’em coming!

    Matt Demers
    19 June 2010 @ 7:47am

  13. great project! I am thinking about starting a similar one. have you ever thought about different scales? or are you just interested in the large scale patterns that emerge?
    I would like to try different scales and have to experiment with what to display in different scales…
    really great project! I love it! And I will definitly start a similar one in Helsinki from now!

    Suse
    3 November 2010 @ 5:27pm

  14. Thanks, Suse, glad to inspire. I haven’t considered scale much; I’ve been thinking of my (spatial) life as existing mostly at the scale shown here, but certainly it would be interesting to look at a variety of scales. In any event, I’d love to see what you end up with in Helsinki!

    Andy Woodruff
    3 November 2010 @ 8:37pm